
Uncertainties
Every measurement a telescope makes of a star or set of stars has a related uncertainty. This is also sometimes called an 'error'. The term uncertainty is more accurate in that it describes how much confidence we have in our values. The term error suggests that mistakes have been made, which may not be the case.
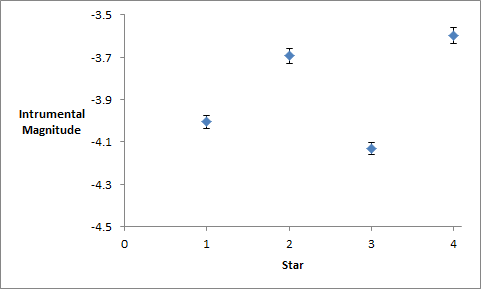
By quantifying the uncertainty, we can add error bars to our data points. This is an easy way to show other people how certain we are about the results.
In your data, the uncertainty comes from something called the signal-to-noise ratio (SNR). This measures the quality of the data. You can think of it as how 'loud' the star's signal is compared to background 'noise'. Generally, an SNR value greater than 100 is considered good for photometry.
Uncertainty = 1/SNR
You can work out the SNR using your V-band data and the FITS header of your data file.
SNR = square root (counts * gain)
The 'counts' is the value that Makali'i measured for a given star. You used it to work out the magnitude of each star. The gain is a measure of how efficient the camera is at turning incoming photons into electrons. The gain can be found in the FITS header.
You can add your error bars to your graph using Excel. There are instructions on the Microsoft Support website. Bear in mind, for many datasets, the error bars will be very small. They may even be smaller than the size of the symbol used to denote the data and may be hard to see.
Credit: Fraser Lewis
Example Calculation
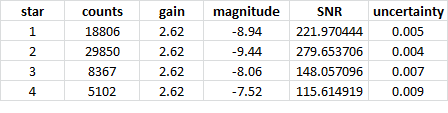
Makali'i measured 18805 counts in V-band for Star 1. The gain is 2.62.
SNR = square root (18805*2.62) = 222
Uncertainty = 1/222 = 0.005 magnitudes
Credit: Fraser Lewis
Reducing the uncertainty
A lower SNR will reduce the error bars. This can be achieved by either increasing the gain or increasing the number of counts. To increase the gain, we would need a better, more efficient (and more expensive) camera. Increasing the counts is easier to do. We can increase the exposure time, use a larger telescope, or study brighter objects.
Error on the colour-index value
It is not as straightforward to work out the error bars for the B-V value. You will first need to work out B-magnitude and V-magnitude errors for each star using the method above. Then you can calculate the B-V error for each star using this formula:
Error on B-V value = square root (error on B magnitude2 + error on V magnitude2)
So the final uncertainty is greater than either uncertainty on its own. However, it is not as large as if we simply added them together.
Note: calculating uncertainties based on magnitudes should actually be done in a more complicated way than shown here. This is because they are logarithmic. However, for the purposes of this project, the method shown here will give a very similar value.
Plot your data.
Draw some conclusions