
Credit: European Southern Observatory (ESO)
From studying stars, we know that the length of their life is linked to their mass. The more mass that they have, the shorter their lifetime. In a way, this feels a little odd; more massive stars contain more fuel, so shouldn't they be the ones to live for longer? Our theories and observations tell us that although they may have more fuel, they use it up much more quickly.
We think a star like our Sun will take about 10 billion years to use up its fuel. A star that contains a few times the mass of our Sun will use up its fuel in less than 1 billion years. A star that contains half the mass of the Sun will take much longer, maybe more than 40 billion years to run out of fuel. That is a long time. We think the Universe is only about 14 billion years old!
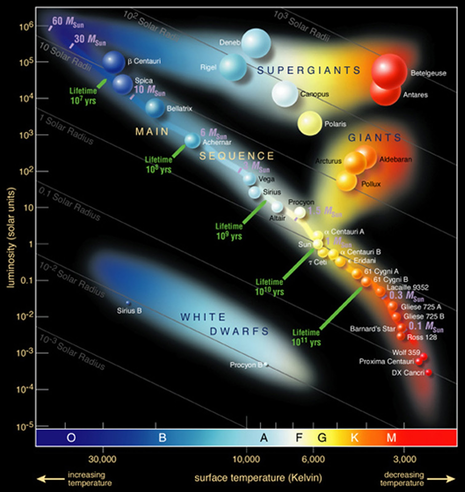
Scientists think a star must contain more than 8 - 100 times the mass of the Sun to explode as a supernova. Though some may be as massive as 200 times the mass of the Sun! Graphs and charts can often help us to make links between and understand large amounts of data. A famous astronomical graph is the Hertzsprung-Russell Diagram. A version of this graph is also known as a colour-magnitude diagram. The graph shows the relationship between a star's temperature and its luminosity, or brightness. The stars that are likely to become supernovae are at the top and top-right of the diagram. These are the very hot and very bright giant and supergiant stars.
However, not all supernovae are the same. Learn about the different types.